

The Miracle Molecule, Part 3
After 4 days of downtime due to a medical issue...

How is everyone coming with the card counting? Can you count one deck perfectly with someone throwing cards in front of you in 2s and 3s? Have you played for an hour with someone playing the role of Dealer? That’s what Eric and I did. It was about as close as we could make it to the real thing but being in a casino took a day to get used to. Nobody can deal as fast as those pro dealers. Soon, we’ll start playing hands together using the count to vary our bets and make playing decisions. Memorize the basic strategy for now.
I have called CO2 The Miracle Molecule for good reason. CO2 saves us in one particular way; its non-linear relationship with warming per molecule. First, let me show you CO2 levels in the atmosphere vs time compared to, first, CO2 emissions by man and then several graphs of atmospheric CO2 vs temperature over several time scales.
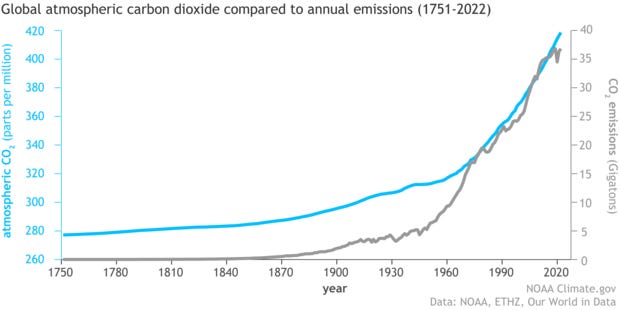
This graph looks at CO2 emissions and atmospheric CO2 over a few hundred years . Its creators are trying to trick you into thinking increased CO2 emissions by man’s activities (such as fossil fuel use) are an important driver of increasing atmospheric CO2. This is the kind of thing every climatista shows during their turn at the debate podium. There’s only one problem. It shows the opposite. While emissions have gone up, what is it 1/2 x 72 times = 36, Atmospheric CO2 has gone up about one half (280 + 1/2 (280)) = 420 for a ratio of 72divided by 1/2 = 144 to 1. It proves CO2 emissions are a very poor driver of atmospheric CO2 increases; the exact opposite of what Al Gore- he used one of these graphs in “An Inconvenient Truth”- and his fellows think it proves.
Now, let’s look at temperature increases vs atmospheric CO2 increases over ~ the same (a few hundred years) time scale.

From 1850 - 1918 (68 years), the average temperature went down as the CO2 increased from 285 to 300. Wait! The temp went DOWN while CO2 went UP?!?! OK… (INVERSE CORRELATION)
Then the temp went up as the CO2 went up until 1943 (33 years). (CORRELATION)
Then the temp went down until 1975 as the CO2 went up (32 years).(INVERSE CORRELATION)
Then the temperature went up until 2017 (42 years) (CORRELATION)
The temperature has gone down since then (7 years) (INVERSE CORRELATION)
The CO2 went up the whole time with an increasing rate in the last 50 years (from 280 to 420) for a net increase of ~50%.
The temperature went down over 107 years and up over 75 years with a net increase of ~1.7 degrees C (because the “ups were bigger, on average, than the “downs”.) (CORRELATION)
Conclusion over the last ~200 years: CO2 emissions are a very poor driver of atmospheric CO2 levels and CO2 levels are only very weakly correlated with temperature.
Now let’s look on the scale of thousands of years.

Over the last 7,000 years, as CO2 has increased steadily, temperatures at the summit of the Greenland ice sheet have DECREASED. (INVERSE CORRELATION)
OK, let’s try on a scale of millions of years.
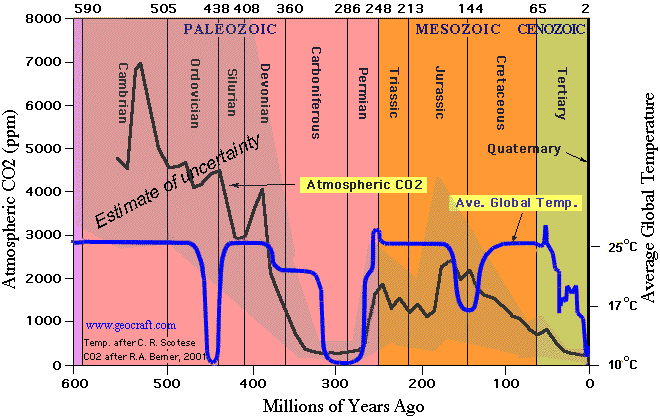
There is no correlation between CO2 and temperature over hundreds of millions of years. We’re within a few hundred parts per million of the lowest CO2 has ever been. Remember, when we get down to about 180 ppm, there isn’t enough CO2 for plants and we start running out of food. Animals are dying too but we eat and preserve them the best we can before they rot. Then we go extinct eating each other.
Note: There was a time when the CO2 was 4500 ppm and the temperature was the same as it is now. We are near the pre-historic and historic low in temperature too but we’ve been warming (about 6 degrees) for about 22,000 years (since the last glacial period when there was a mile of ice on top of Boston)..
Here’s an interesting and funny time line Mike from Perth, Australia made, covering the last 20,000 years or so. At the end, he reveals himself as a Climatista, sadly.

Just as it did with the whole covid debacle, the climate hoax is beginning to unravel.
Really concise summary Dr. Sheftall.
What do you believe are the best arguments for the CO2 driven warming model? Despite the tsunami of propaganda that comes up when you do any kind of search, their actual analysis is hidden or deeply embedded some place.
I am presently writing a position paper on this and would like to be able to dismantle their arguments point by point. Any idea where to look?